When debugging a program or trying to understand its actual inner working, breakpoints are a very useful tool afforded by the CPU and debugger. Breakpoints return control to an attached debugger when a specified condition is met in the process that is being debugged. These conditions include a memory read, write, or execution at a certain address.
On Intel’s x86 architecture, there are 2 types of breakpoints available:
- Hardware breakpoint- uses CPU’s DR0-DR3 debug registers to store memory addresses. Debug exceptions are generated by the CPU when a memory read, write or execute occurs at or near an address in any of the 4 Debug Registers, useful when we want to see where a memory address was read from or written to
- Software breakpoint- a patched instruction in executable code to generate a breakpoint exception. This instruction is “INT 3” or 0xCC in machine code. useful if we want to stop execution at a certain instruction
Hardware Breakpoints
In a Windbg session debugging notepad.exe, one can set a hardware breakpoint as follows:
0:001> ba e1 ntdll!ZwCreateFile
Lets verify that the breakpoint was set:
0:001> bl
 0 e 00000000`773ffc00 e 1 0001 (0001)  0:**** ntdll!ZwCreateFile
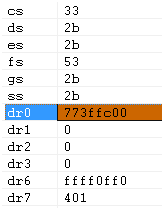
Now, let’s verify that the address of our hardware breakpoint actually shows up in the CPU’s debug registers:

As expected, DR0 contains the virtual address of ntdll!ZwCreateFile. When we try to save a file in notepad, we hit our breakpoint:
Breakpoint 0 hit
ntdll!ZwCreateFile:
00000000`773ffc00 4c8bd1          mov     r10,rcx
Software Breakpoints
Software breakpoints are set in Windbg using a slightly different command:
0:001> bp ntdll!ZwCreateFile
Again, we verify that our breakpoint has been set:
0:001> bl
 0 e 00000000`773ffc00     0001 (0001)  0:**** ntdll!ZwCreateFile
Here’s what it looks like when we hit our software breakpoint:
Breakpoint 0 hit
ntdll!ZwCreateFile:
00000000`773ffc00 4c8bd1          mov     r10,rcx
The implementation of a software breakpoint is interesting. The fact that its opcode (0xCC) is exactly 1 byte long was probably driven by the design requirement that it be easy to patch an instruction, which in the x86 architecture is always byte-aligned in location and length. This also makes sense because the smallest granularity of memory access in x86 is 1 byte, making it a byte-accessible machine.
When a software breakpoint is set and the desired instruction in memory is overwritten by the 0xCC byte, the original byte that was overwritten is stored and associated to this software breakpoint in an associative data structure, so that the debugger knows what instruction to execute in order to maintain the original program’s logic once it reaches the patched address. Due to the fact that this association is stored in memory and not in a hardware register somewhere in the CPU, we are able to set many more software breakpoints than the maximum of 4 hardware breakpoints.
Finally, it is important to note that software breakpoints patch instructions with the 0xCC byte, and this byte will only halt execution if it is interpreted as an instruction to be executed rather than data that is read or written. The significance of this is that we can only use software breakpoints to break if the CPU executes(not reads or writes) the contents of the breakpoint address. This is why hardware breakpoints can break on a memory read or write, while software breakpoints cannot.
Comparison
Below is a summary of the capabilities of hardware and software breakpoints:
| Hardware Breakpoint | Software Breakpoint | |
| Read | X | |
| Write | X | |
| Execute | X | X |
By: Neil Sikka
